
inukshuk/sqleton
inukshuk/sqleton has 120 GitHub stars and 12 forks. Star changes are not measured yet. Last checked 2026-11-14 11:46 UTC. Last push 2026-11-10.
Gemessener Sternzuwachs
- in 24h
- Verlauf wird gesammelt
- in 7 days
- Verlauf wird gesammelt
- in 15 days
- Verlauf wird gesammelt
- in 1 month
- Verlauf wird gesammelt
Nettoänderungen in überlappenden Zeiträumen, keine Tagessummen. Fehlende Messwerte bleiben leer. Sterne zeigen Interesse, nicht Qualität.
Über uns
Visualize your SQLite database schema
DatenREADME.md
Originalsqleton ['skelɪtən]
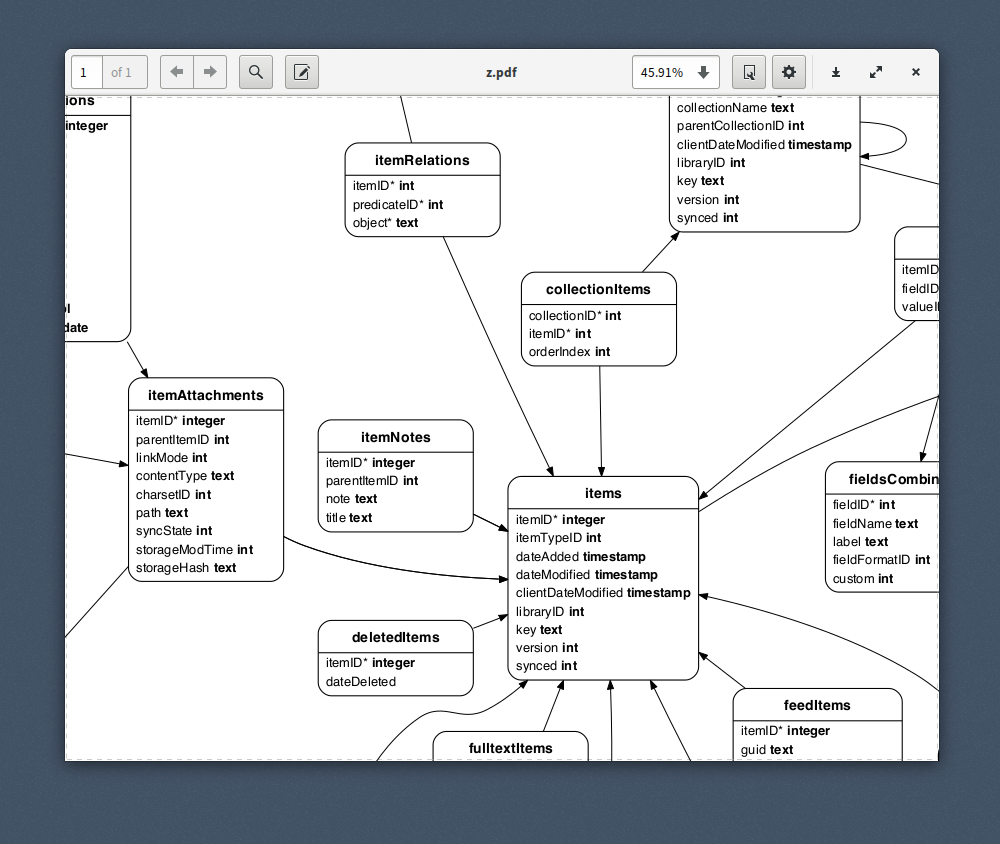
Visualizes your SQLite database schema.
Installation
$ npm install -g sqleton
You need to install graphviz separately:
$ [pacman -Sy | apt-get install | brew install] graphviz
Example
$ sqleton -o db.svg db.sqlite
The format will be inferred from the name of the output file; you
can use any format supported by graphviz (png, pdf, svg, and many more).
Usage
Usage: sqleton [options] <db-file>

Options:
  -h, --help        Print this help text and exit
  -v, --version     Print program version and exit
  -L, --layout      The layout command, one of:
                      "neato", "dot", "circo",
                      "fdp" (default),
                      "osage", "sfdp", "twopi"

  -e, --edge-labels  Label foreign key edges
  -t, --title        Optional title string
  -f, --font         The font to use, by default "Helvetica"
  -d, --direction    Graph direction, "TB" or "LR" (default)
  -o, --out          Output file (determines output format)
                     if not given DOT will be printed to stdout

      --skip-index   Skip writing table indexes
Fine-Tuning
To fine-tune your graph, the best option is to use .dot as your output
format and adjust the parameters in the file.
Node.js
const sqleton = require('sqleton')

// Open your database and writable stream
// ....

sqleton(db, stream, options)
  .then(() => { db.close() })
  .then(() => { stream.end() })
What about PostgreSQL or other databases?
sqleton was written to visualize SQLite schemata. Having said that,
you can try to dump your schema and create a new SQLite database for
visualisation from it.
Ähnliche Projekte entdecken
Asabeneh/30-Days-Of-Python
Die Programmier-Challenge 30 Days of Python ist eine Schritt-für-Schritt-Anleitung, um die Programmiersprache Python in 30 Tagen zu lernen. Diese Challenge kann mehr als 100 Tage dauern. Gehe in deinem eigenen Tempo vor. Diese Videos können ebenfalls helfen: https://www.youtube.com/channel/UC7PNRuno1rzYPb1xLa4yktw
78,729 Sternegrafana/grafana
Offene und kombinierbare Plattform für Observability und Datenvisualisierung. Visualisiert Metriken, Logs und Traces aus mehreren Quellen wie Prometheus, Loki, Elasticsearch, InfluxDB, Postgres und vielen weiteren.
77,898 Sterneredis/redis
Für Entwickler, die echtzeitfähige, datengesteuerte Anwendungen erstellen, ist Redis der bevorzugte, schnellste und funktionsreichste Cache, Datenstrukturserver und die entsprechende Abfrageengine für Dokumente und Vektoren.
77,491 Sterneapache/superset
Apache Superset ist eine Plattform für Datenvisualisierung und Datenexploration.
75,522 Sterne