
intel/npu-nn-cost-model
intel/npu-nn-cost-model has 35 GitHub stars and 7 forks. Star changes are not measured yet. Last checked 2026-11-14 12:59 UTC. Last push 2026-11-09.
Gemessener Sternzuwachs
- in 24h
- Verlauf wird gesammelt
- in 7 days
- Verlauf wird gesammelt
- in 15 days
- Verlauf wird gesammelt
- in 1 month
- Verlauf wird gesammelt
Nettoänderungen in überlappenden Zeiträumen, keine Tagessummen. Fehlende Messwerte bleiben leer. Sterne zeigen Interesse, nicht Qualität.
Über uns
Library for modelling performance costs of different Neural Network workloads on NPU devices
Maschinelles LernenREADME.md
OriginalVPUNN cost model
A NN-Based Cost Model for VPU Devices. For additional information about model setup and training, please refer this paper
If you find this work useful, please cite the following paper:
@article{DBLP:journals/corr/abs-2205-04586,
  doi = {10.48550/ARXIV.2205.04586},
  url = {https://arxiv.org/abs/2205.04586},
  author = {Hunter, Ian Frederick Vigogne Goodbody and Palla, Alessandro and Nagy, Sebastian Eusebiu and Richmond, Richard and McAdoo, Kyle},
  title = {Towards Optimal VPU Compiler Cost Modeling by using Neural Networks to Infer Hardware Performances},
  publisher = {arXiv},
  year = {2022},
  copyright = {arXiv.org perpetual, non-exclusive license}
}
Setup
GCC version should be > 9. You can check your GCC version by running gcc --version and g++ --version
If you do not set CC and CXX environment variables, which gcc and which g++ are used by default.
Compile the library by typing cmake -H. -Bbuild && cmake --build build
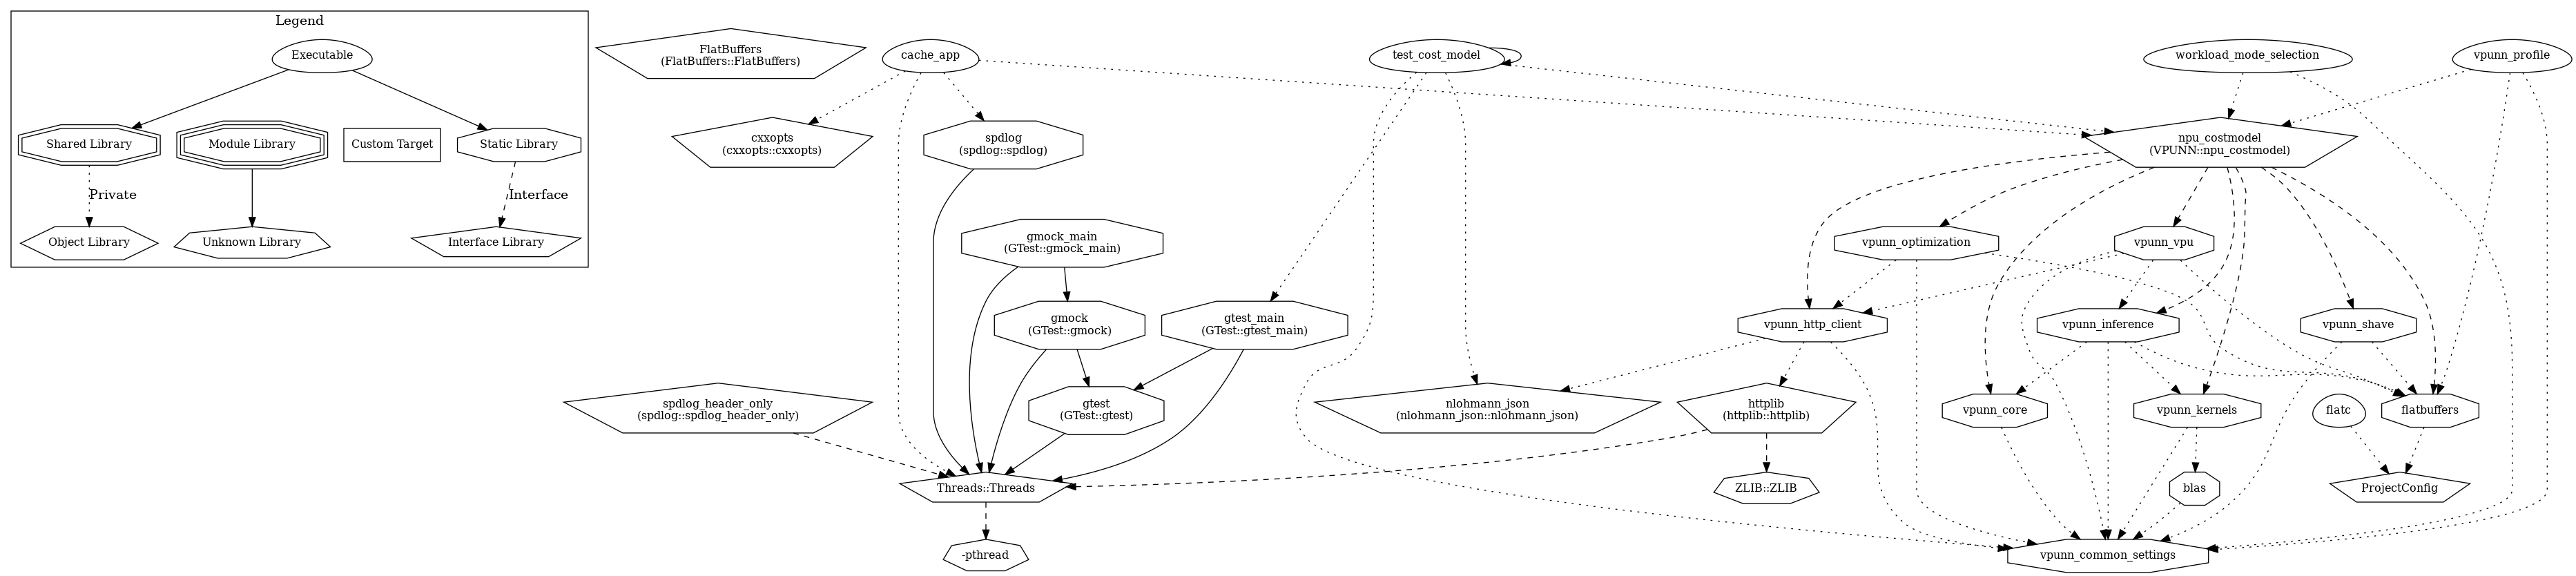
General architecture diagram of target interactions, using command cmake -DCBLAS_LIB=openblas -DVPUNN_BUILD_HTTP_CLIENT=ON -DVPUNN_BUILD_APPS=ON -DCMAKE_BUILD_TYPE=Coverage -H. -Bbuild is presented here:
@TODO: environment compatible with newer compiler versions (gcc>=10, clang >10 )
Use Intel oneAPI MKL
Install oneAPI base Toolkit (instructions). oneAPI is massive so feel free to install only the Math Kernel Library library.
If you have troubles with proxy, please export no_proxy=127.0.0.1 in order to bypass any no_proxy env vs *.intel.com urls
To enable MKL you need to source this file /opt/intel/oneapi/setvars.sh to set the appropriate environment variables. Look here on how to get started with VSC
Select BLAS library
You can select which BLAS library to use (assume you have MKL installed) and the threading mode by using the following cmake variables
-DCBLAS_LIB=<value>(options:mklfor oneMKL andopenblasfor OpenBLAS)-DMKL_THREADING=<value>(options:tbbfor oneAPI Threading Building Blocks andsequentialfor no threading)
Using the cost model: C++
To use the VPUN cost model in a cmake project is quite simple. An example of a CMakeLists.txt file is shown below
include_directories(${CMAKE_BINARY_DIR}/include)
include_directories(${FLATBUFFERS_SRC_DIR}/include)

...

target_link_libraries(<your exe or lib> inference)
The following example code explains how to instantiate the cost model and how to run a simple query for a 3x3s1 convolution
#include "vpu_cost_model.h"

auto model = VPUNN::VPUCostModel(model_path);

auto dpu_cycles = model.DPU({VPUNN::VPUDevice::VPU_2_7,
                             VPUNN::Operation::CONVOLUTION,
                             {VPUNN::VPUTensor(56, 56, 16, 1, VPUNN::DataType::UINT8)}, // input dimensions
                             {VPUNN::VPUTensor(56, 56, 16, 1, VPUNN::DataType::UINT8)}, // output dimensions
                             {3, 3}, //kernels
                             {1, 1}, //strides
                             {1, 1}, //padding
                             VPUNN::ExecutionMode::CUBOID_16x16} // execution mode
                            );
The example folder contains few examples on how to build and use the cost model in a C++ project. The following list is a WIP of the supported example:
workload_mode_selection:- Selecting the optimal MPE mode for a VPU_2_0 workload
- Choosing the optimal workload split strategy amound multiple ones
Install
To test the install option, for find_package(VPUNN) functionality.
git clone <repo-url> <repo-name>
cd <repo-name>
cmake -S . -B build
cmake --build build -j
cmake --install build --prefix <install-path> [--config <config-type-for-multiconfig-systems (windows)>]
cd <your-custom-repo>
cmake -S . -B build -DCMAKE_PREFIX_PATH=<install-path>
cmake --build build -j
Using the cost model: Python
To install the Python package, run the following command from the root of the repository:
pip install .
This will use scikit-build to compile the C++ extension (bindings) and install the Python package.
It is recommended to do this in a python virtual environment.
Developer guide
Git hooks
All developers should install the git hooks that are tracked in the .githooks directory. We use the pre-commit framework for hook management. The recommended way of installing it is using pip:
pip install pre-commit
The hooks can then be installed into your local clone using:
pre-commit install --allow-missing-config
--allow-missing-config is an optional argument that will allow users to have the hooks installed and be functional even if using an older branch that does not have them tracked. A warning will be displayed for such cases when the hooks are ran.
If you want to manually run all pre-commit hooks on a repository, run pre-commit run --all-files. To run individual hooks use pre-commit run <hook_id>.
Uninstalling the hooks can be done using
pre-commit uninstall
Testing the library
Cost model test (C++)
Tests uses Google test suite for automatizing tests
To run the test suite: ctest --test-dir build/tests/cpp/
Example: running only cost model integration test: ./tests/cpp/test_cost_model
All C++ tests in a test executable use the same global utest_log logger. It is created once per test process and is configured before the test suite starts. Tests should use utest_log for test logging rather than creating another global test logger.
For example, these tests write through the same logger instance:
TEST(LoggerExample, FirstTest) {
  utest_log::info() << "Message from the first test";
}

TEST(LoggerExample, SecondTest) {
  utest_log::LogLevelScope log_level(utest_log::Level::debug);
  utest_log::debug() << "Debug message enabled only in this scope";
}
The logger stream object is utest_log::Stream; it is intended for temporary use only. It buffers output until destruction, so a static or long-lived stream could outlive the shared logger and emit after shutdown. Use the normal temporary helpers such as utest_log::info() and utest_log::debug() instead. Stream is neither copyable nor movable, since a moved-from stream would still emit its (now stale) buffered content when destroyed.
By default, the test logger uses the info level. To change the global logger level, use the --logger_level command-line option when running the test executable:
./tests/cpp/test_cost_model --logger_level debug
When running tests through ctest, set the LOGGER_LEVEL environment variable instead:
LOGGER_LEVEL=debug ctest --test-dir build/tests/cpp/
Valid levels are trace, debug, info, warn, err, critical, and off. The command-line option takes precedence over LOGGER_LEVEL; if neither is specified, info is used. Invalid values are treated as off.
To change the logger level for a specific test, use a utest_log::LogLevelScope guard with a utest_log::Level::level_enum value (equivalently, a spdlog::level::level_enum value). This temporarily changes the shared logger level for the scope and restores the previous level when the guard is destroyed. The guard is intended for the current GoogleTest execution model, where test bodies run sequentially within a test process. It must not be used by overlapping test bodies or by concurrent scopes that change the logger level in the same process. Tests may still use worker threads that only log while the guard is active; the level is shared by those threads. Running CTest with parallelism uses separate processes, each with its own logger.
E2E Python test
pytest tests/python/test_e2e.py -v
Code coverage
To generate Code coverage report you need to enable it in CMake
cmake -DCMAKE_BUILD_TYPE=Coverage .. && make coverage -j
This commands generate a coverage folder into the build one with all the coverage information
Dependencies:
- Gcov-9 and Gcovr tools are needed in order to generate the report
- Only GCC is supported (no WASM/Visual Studio)
Notice about configurations not covered by training, or with greater errors.
NPU2.0
Not Available
NPU2.7
ISI=CLUSTERING + OWT=2 : replaced at runtime with SOK. runtime should be the same, no input halo used
Elementwise + ISI=SOK : replaced at runtime with clustering + owt=1, time is a little undervalued, but its the best approximation available
CM_CONV (compress convolution) + InputChannels=1
SOH (HALO) split with Kernel =1 has probably not been part of training, doesn't make sense to have kernel=1 and input halo.NN predictions are problematic. : replaced at runtime with Clustering.
SOH Halo split , at least when H is small, K small, produces much bigger results than SOH Overlapped. This is not realistic, might be a NN limitation. See VPULayerCostModelTest.Unet_perf_SOH_SOK_after_SOHO
Output write tiles is limited to 2. EG also when used as mock for NPU4.0 where more than 2 tiles are present and used for split.
NPU2.7 splits by H with Halo were trained to NN using the memory tensor instead of the general rule for compute tensor (memory tensor is smaller with half a kernel in general). Calling NN with compute tensor introduces errors by reporting smaller values. To get corrected values (closer to Ground Truth) when generating the descriptor for NNs with interface 11 and SOH isi strategy, we are using not the input tensor, but a computed memory input tensor that mimics the one used at training
NPU4.0 (in development)
Reusing:when using the 2.7 trained version as mock please read the NPU2.7 section above.
- DW_CONV (depthwise convolution)with kernel 3x3 is optimized in NPU4.0, but not in NPU2.7. The NN reported runtime is adjusted with a factor depending on datatype, channels and kernel size Trained NN for 4.0:
- WIP
Known problems:
- NPU2.7: NN was not trained to discriminate the sporadic high runtime for swizzling. EISXW-98656 not solved (ELt wise add with big profiled CLUSTERING, but small SOH) Test: RuntimeELT_CONV_SOH_SOK_EISXW_98656. Elementwise accepts (at NN run) SWizzling ON or OFF but has to be the same for all in/out/wts all 0 (OFF), all 5(ON) combinations not trained. To consider: training of NN with swizzlings combinations (profiling shows runtime is different)
SHAVE operators available
Shave version interface 1 (the old one) will be deleted in the near future, do not use it. SHAVE v2 interface is active.
Details of any operator can be obtained by calling: ShaveOpExecutor::toString() method.
For most updated list of operators and their details see also the unit tests: TestSHAVE.SHAVE_v2_ListOfOperators, TestSHAVE.SHAVE_v2_ListOfOperatorsDetails_27,... .
For information about the profiled operators and extraparameters you can consult this document
Cost providers
The cost model is designed to be extensible. The cost providers are the classes that implement the cost model for a specific device. The cost providers are selected at runtime based on the device type. The following cost providers are available:
- NN based cost provider - is a learned performance model.
- Theoretical cost provider - is a simple mathematical model.
- "Oracle" cost provider - a LUT of measured performance for specific workloads.
- Profiled cost provider - it's an http service that can be queried to get the measured performance of a specific workload.
- Currently it supports only DPU costs and it can be configured using the following env. variables
ENABLE_VPUNN_PROFILING_SERVICE--TRUEto enable the profiling serviceVPUNN_PROFILING_SERVICE_BACKEND--siliconto use the RVP for profiling,vpuemto use VPUEM as a cost provider.VPUNN_PROFILING_SERVICE_HOST-- address of the profiling service host, default isirlccggpu04.ir.intel.comVPUNN_PROFILING_SERVICE_PORT-- port of the profiling service, default is5000
- Currently it supports only DPU costs and it can be configured using the following env. variables
To see a list of all queried workloads and which cost provider was used for each, set the environment variable ENABLE_VPUNN_DATA_SERIALIZATION to TRUE.
This will generate a couple of csv files in the directory where vpunn is used.