
achillesrasquinha/bulbea has 2,345 GitHub stars and 485 forks. GitHot measured 0 stars in 24 hours, -2 in 7 days, and -1 in 15 days. Last checked 2026-11-22 03:52 UTC. Last push 2021-01-17.
Gemessener Sternzuwachs
- in 24h
- 0
- in 7 days
- -2
- in 15 days
- -1
- in 1 month
- Verlauf wird gesammelt
Nettoänderungen in überlappenden Zeiträumen, keine Tagessummen. Fehlende Messwerte bleiben leer. Sterne zeigen Interesse, nicht Qualität.
Über uns
:boar: :bear: Python-Bibliothek auf Basis von Deep Learning zur Vorhersage und Modellierung von Aktienmärkten
Maschinelles LernenREADME.md
Originalbulbea
"Deep Learning based Python Library for Stock Market Prediction and Modelling."


Table of Contents
Installation
Clone the git repository:
$ git clone https://github.com/achillesrasquinha/bulbea.git && cd bulbea
Install necessary dependencies
$ pip install -r requirements.txt
Go ahead and install as follows:
$ python setup.py install
You may have to install TensorFlow:
$ pip install tensorflow     # CPU
$ pip install tensorflow-gpu # GPU - Requires CUDA, CuDNN
Usage
1. Prediction
a. Loading
Create a share object.
>>> import bulbea as bb
>>> share = bb.Share('YAHOO', 'GOOGL')
>>> share.data
# Open        High         Low       Close      Volume  \
# Date
# 2004-08-19   99.999999  104.059999   95.959998  100.339998  44659000.0
# 2004-08-20  101.010005  109.079998  100.500002  108.310002  22834300.0
# 2004-08-23  110.750003  113.479998  109.049999  109.399998  18256100.0
# 2004-08-24  111.239999  111.599998  103.570003  104.870002  15247300.0
# 2004-08-25  104.960000  108.000002  103.880003  106.000005   9188600.0
...
b. Preprocessing
Split your data set into training and testing sets.
>>> from bulbea.learn.evaluation import split
>>> Xtrain, Xtest, ytrain, ytest = split(share, 'Close', normalize = True)
c. Modelling
>>> import numpy as np
>>> Xtrain = np.reshape(Xtrain, (Xtrain.shape[0], Xtrain.shape[1], 1))
>>> Xtest  = np.reshape( Xtest, ( Xtest.shape[0],  Xtest.shape[1], 1))

>>> from bulbea.learn.models import RNN
>>> rnn = RNN([1, 100, 100, 1]) # number of neurons in each layer
>>> rnn.fit(Xtrain, ytrain)
# Epoch 1/10
# 1877/1877 [==============================] - 6s - loss: 0.0039
# Epoch 2/10
# 1877/1877 [==============================] - 6s - loss: 0.0019
...
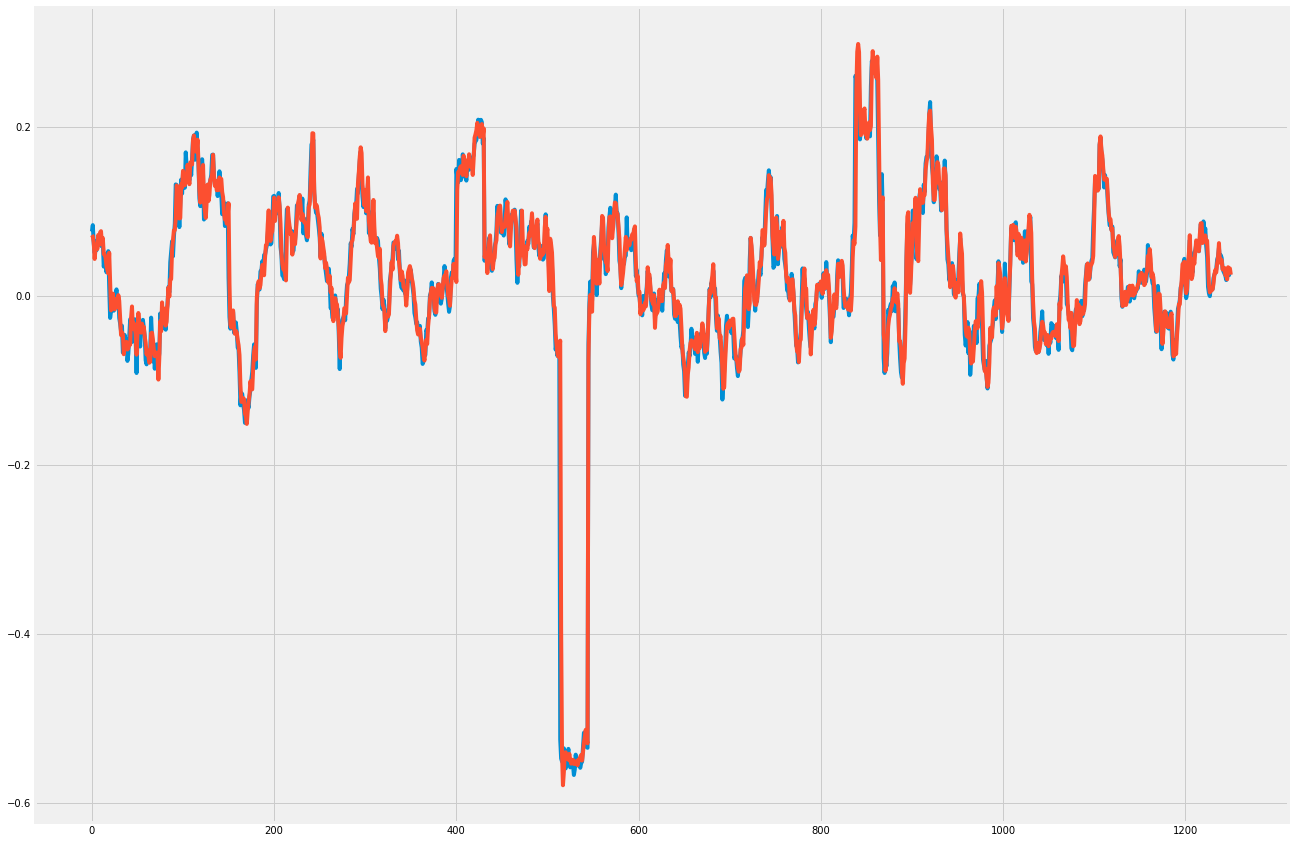
d. Testing
>>> from sklearn.metrics import mean_squared_error
>>> p = rnn.predict(Xtest)
>>> mean_squared_error(ytest, p)
0.00042927869370525931
>>> import matplotlib.pyplot as pplt
>>> pplt.plot(ytest)
>>> pplt.plot(p)
>>> pplt.show()
2. Sentiment Analysis
Add your Twitter credentials to your environment variables.
export BULBEA_TWITTER_API_KEY="<YOUR_TWITTER_API_KEY>"
export BULBEA_TWITTER_API_SECRET="<YOUR_TWITTER_API_SECRET>"

export BULBEA_TWITTER_ACCESS_TOKEN="<YOUR_TWITTER_ACCESS_TOKEN>"
export BULBEA_TWITTER_ACCESS_TOKEN_SECRET="<YOUR_TWITTER_ACCESS_TOKEN_SECRET>"
And then,
>>> bb.sentiment(share)
0.07580128205128206
Documentation
Detailed documentation is available here.
Dependencies
- quandl
- keras
- tweepy
- textblob
License
This code has been released under the Apache 2.0 License.
Ähnliche Projekte entdecken
Wird geladen…