
Yous3ry/Python_Automated_DCA
Yous3ry/Python_Automated_DCA has 26 GitHub stars and 13 forks. Star changes are not measured yet. Last checked 2026-11-14 01:53 UTC. Last push 2026-11-11.
Gemessener Sternzuwachs
- in 24h
- Verlauf wird gesammelt
- in 7 days
- Verlauf wird gesammelt
- in 15 days
- Verlauf wird gesammelt
- in 1 month
- Verlauf wird gesammelt
Nettoänderungen in überlappenden Zeiträumen, keine Tagessummen. Fehlende Messwerte bleiben leer. Sterne zeigen Interesse, nicht Qualität.
Über uns
Python Automatic Decline Curve Analysis (DCA) For Petroleum Producing wells
DatenREADME.md
OriginalPython Automatic Decline Curve Analysis (DCA) For Petroleum Producing wells
Table of Contents
About The Project
Decline Curve Analysis (DCA) is a widely accepted method for analyzing declining production rates and forecasting future performance of oil and gas wells. [1] For oil fields with hundreds or even thousands of wells updating the production forecast for each well based on DCA could be very time consuimg. Here's why:
- Typically curve fitting to estimate the decline rate and initial rate is done graphically which could be very time consuming, and
- Over the life of a conventional oil producing well, decline rates may change over time with changes in operating conditions, e.g. start of water injection, aritifical lift methodlogy or effciency changes, etc. Thus the history of the well could be divided into different distinct regions and DCA parameters should only be estimated based on the last stable producing conditions rather than average fitting of all the historical performance.
Workflow
- Connect to production database to read well data (Python File here)
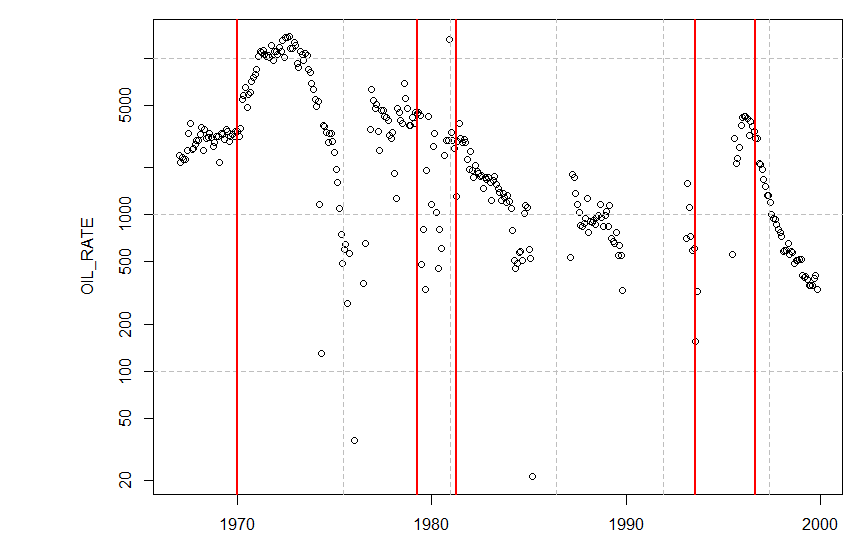
- Use R to detect change points assuming a piecewise linear trend using EnvCpt Package[2] as shown in example below (R File here)
- Finally an integrated Python file (Final Python File here) is used to a) Load Well Data b) detect change points using R via Rpy2 c) fit exponential or Hyperbolic decline based on user input on the last stable period d) Forecast production rate. Note forecast is limited by user minimum rate and forecast period.
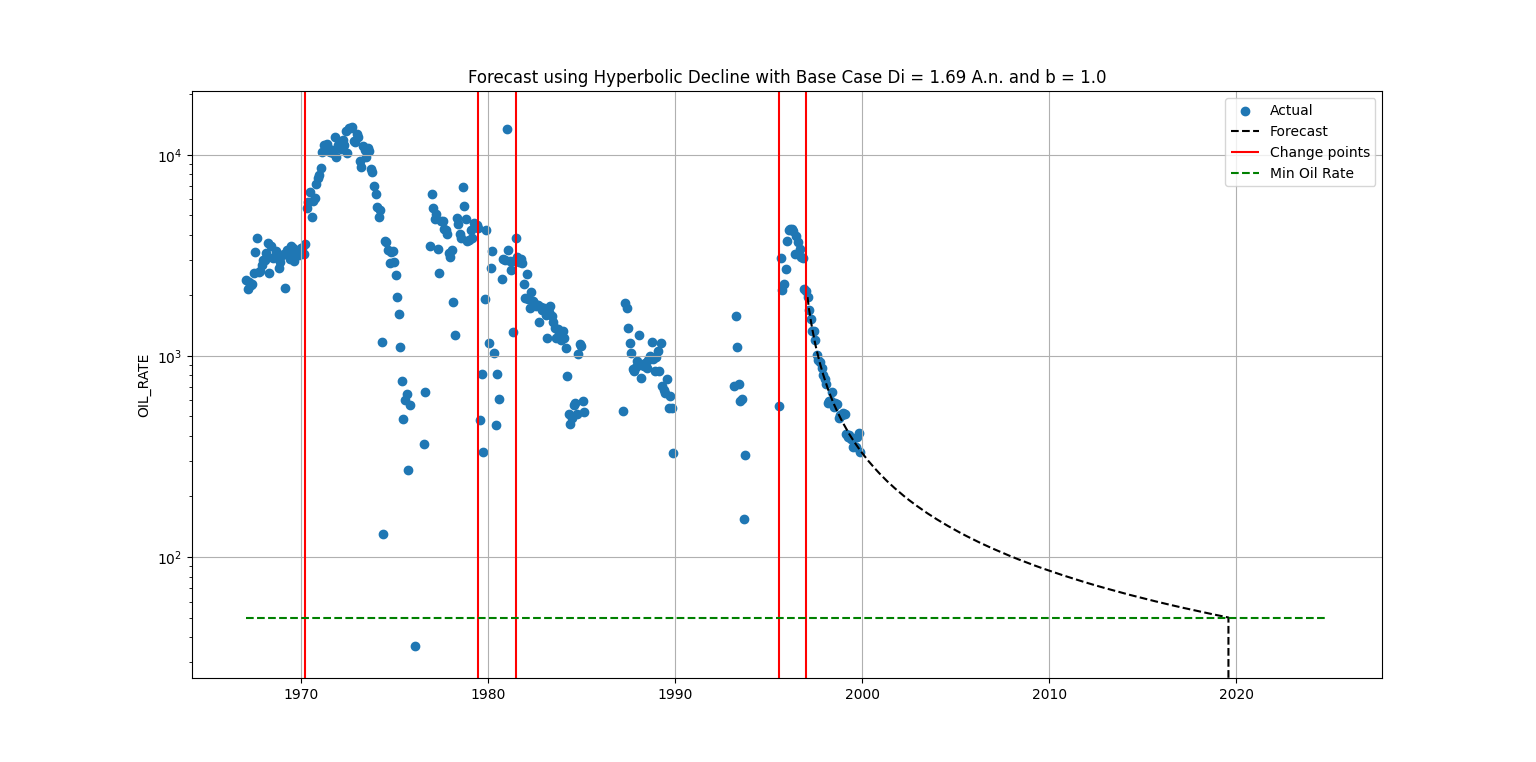
NOTE A compiled Python Script integrates all previous steps and loops through all the wells in the database and exports the total field/company forecast. (Compiled Python File here)
Dependencies
Python Packages <- sqlalchemy, scipy, matplotlib, pandas, numpy, json, rpy2
R Packages <- EnvCpt
References
[1]
https://petrowiki.spe.org/Production_forecasting_decline_curve_analysis#:~:text=Decline%20curve%20analysis%20(DCA)%20is,fluids%2C%20are%20usually%20the%20cause.
[2]
https://rdrr.io/cran/EnvCpt/man/envcpt.html
Ähnliche Projekte entdecken
Asabeneh/30-Days-Of-Python
Die Programmier-Challenge 30 Days of Python ist eine Schritt-für-Schritt-Anleitung, um die Programmiersprache Python in 30 Tagen zu lernen. Diese Challenge kann mehr als 100 Tage dauern. Gehe in deinem eigenen Tempo vor. Diese Videos können ebenfalls helfen: https://www.youtube.com/channel/UC7PNRuno1rzYPb1xLa4yktw
78,710 Sternegrafana/grafana
Offene und kombinierbare Plattform für Observability und Datenvisualisierung. Visualisiert Metriken, Logs und Traces aus mehreren Quellen wie Prometheus, Loki, Elasticsearch, InfluxDB, Postgres und vielen weiteren.
77,892 Sterneredis/redis
Für Entwickler, die echtzeitfähige, datengesteuerte Anwendungen erstellen, ist Redis der bevorzugte, schnellste und funktionsreichste Cache, Datenstrukturserver und die entsprechende Abfrageengine für Dokumente und Vektoren.
77,490 Sterneapache/superset
Apache Superset ist eine Plattform für Datenvisualisierung und Datenexploration.
75,521 Sterne