
0hardik1/kubesplaining
0hardik1/kubesplaining has 101 GitHub stars and 7 forks. Star changes are not measured yet. Last checked 2026-11-14 02:03 UTC. Last push 2026-11-12.
Gemessener Sternzuwachs
- in 24h
- Verlauf wird gesammelt
- in 7 days
- Verlauf wird gesammelt
- in 15 days
- Verlauf wird gesammelt
- in 1 month
- Verlauf wird gesammelt
Nettoänderungen in überlappenden Zeiträumen, keine Tagessummen. Fehlende Messwerte bleiben leer. Sterne zeigen Interesse, nicht Qualität.
Über uns
Kubernetes security assessment CLI: RBAC, pod-escape, and privilege-escalation path analysis. Cloudsplaining for Kubernetes.
EntwicklerwerkzeugeREADME.md
OriginalKubesplaining


Kubesplaining is an open-source Kubernetes security assessment CLI that reads a live cluster or a captured snapshot and tells you exactly how an attacker can move through it. Unlike scanners that stop at "this resource is misconfigured," it builds a multi-hop RBAC privilege-escalation graph from every non-system subject to nine sinks (among them cluster-admin, system:masters, node-escape, and kube-system-secrets) and renders each chain with the actual verbs, evidence, and remediation. Outputs are risk-prioritized HTML, JSON, CSV, and SARIF reports for human review, GitHub code scanning, or CI delta gates.
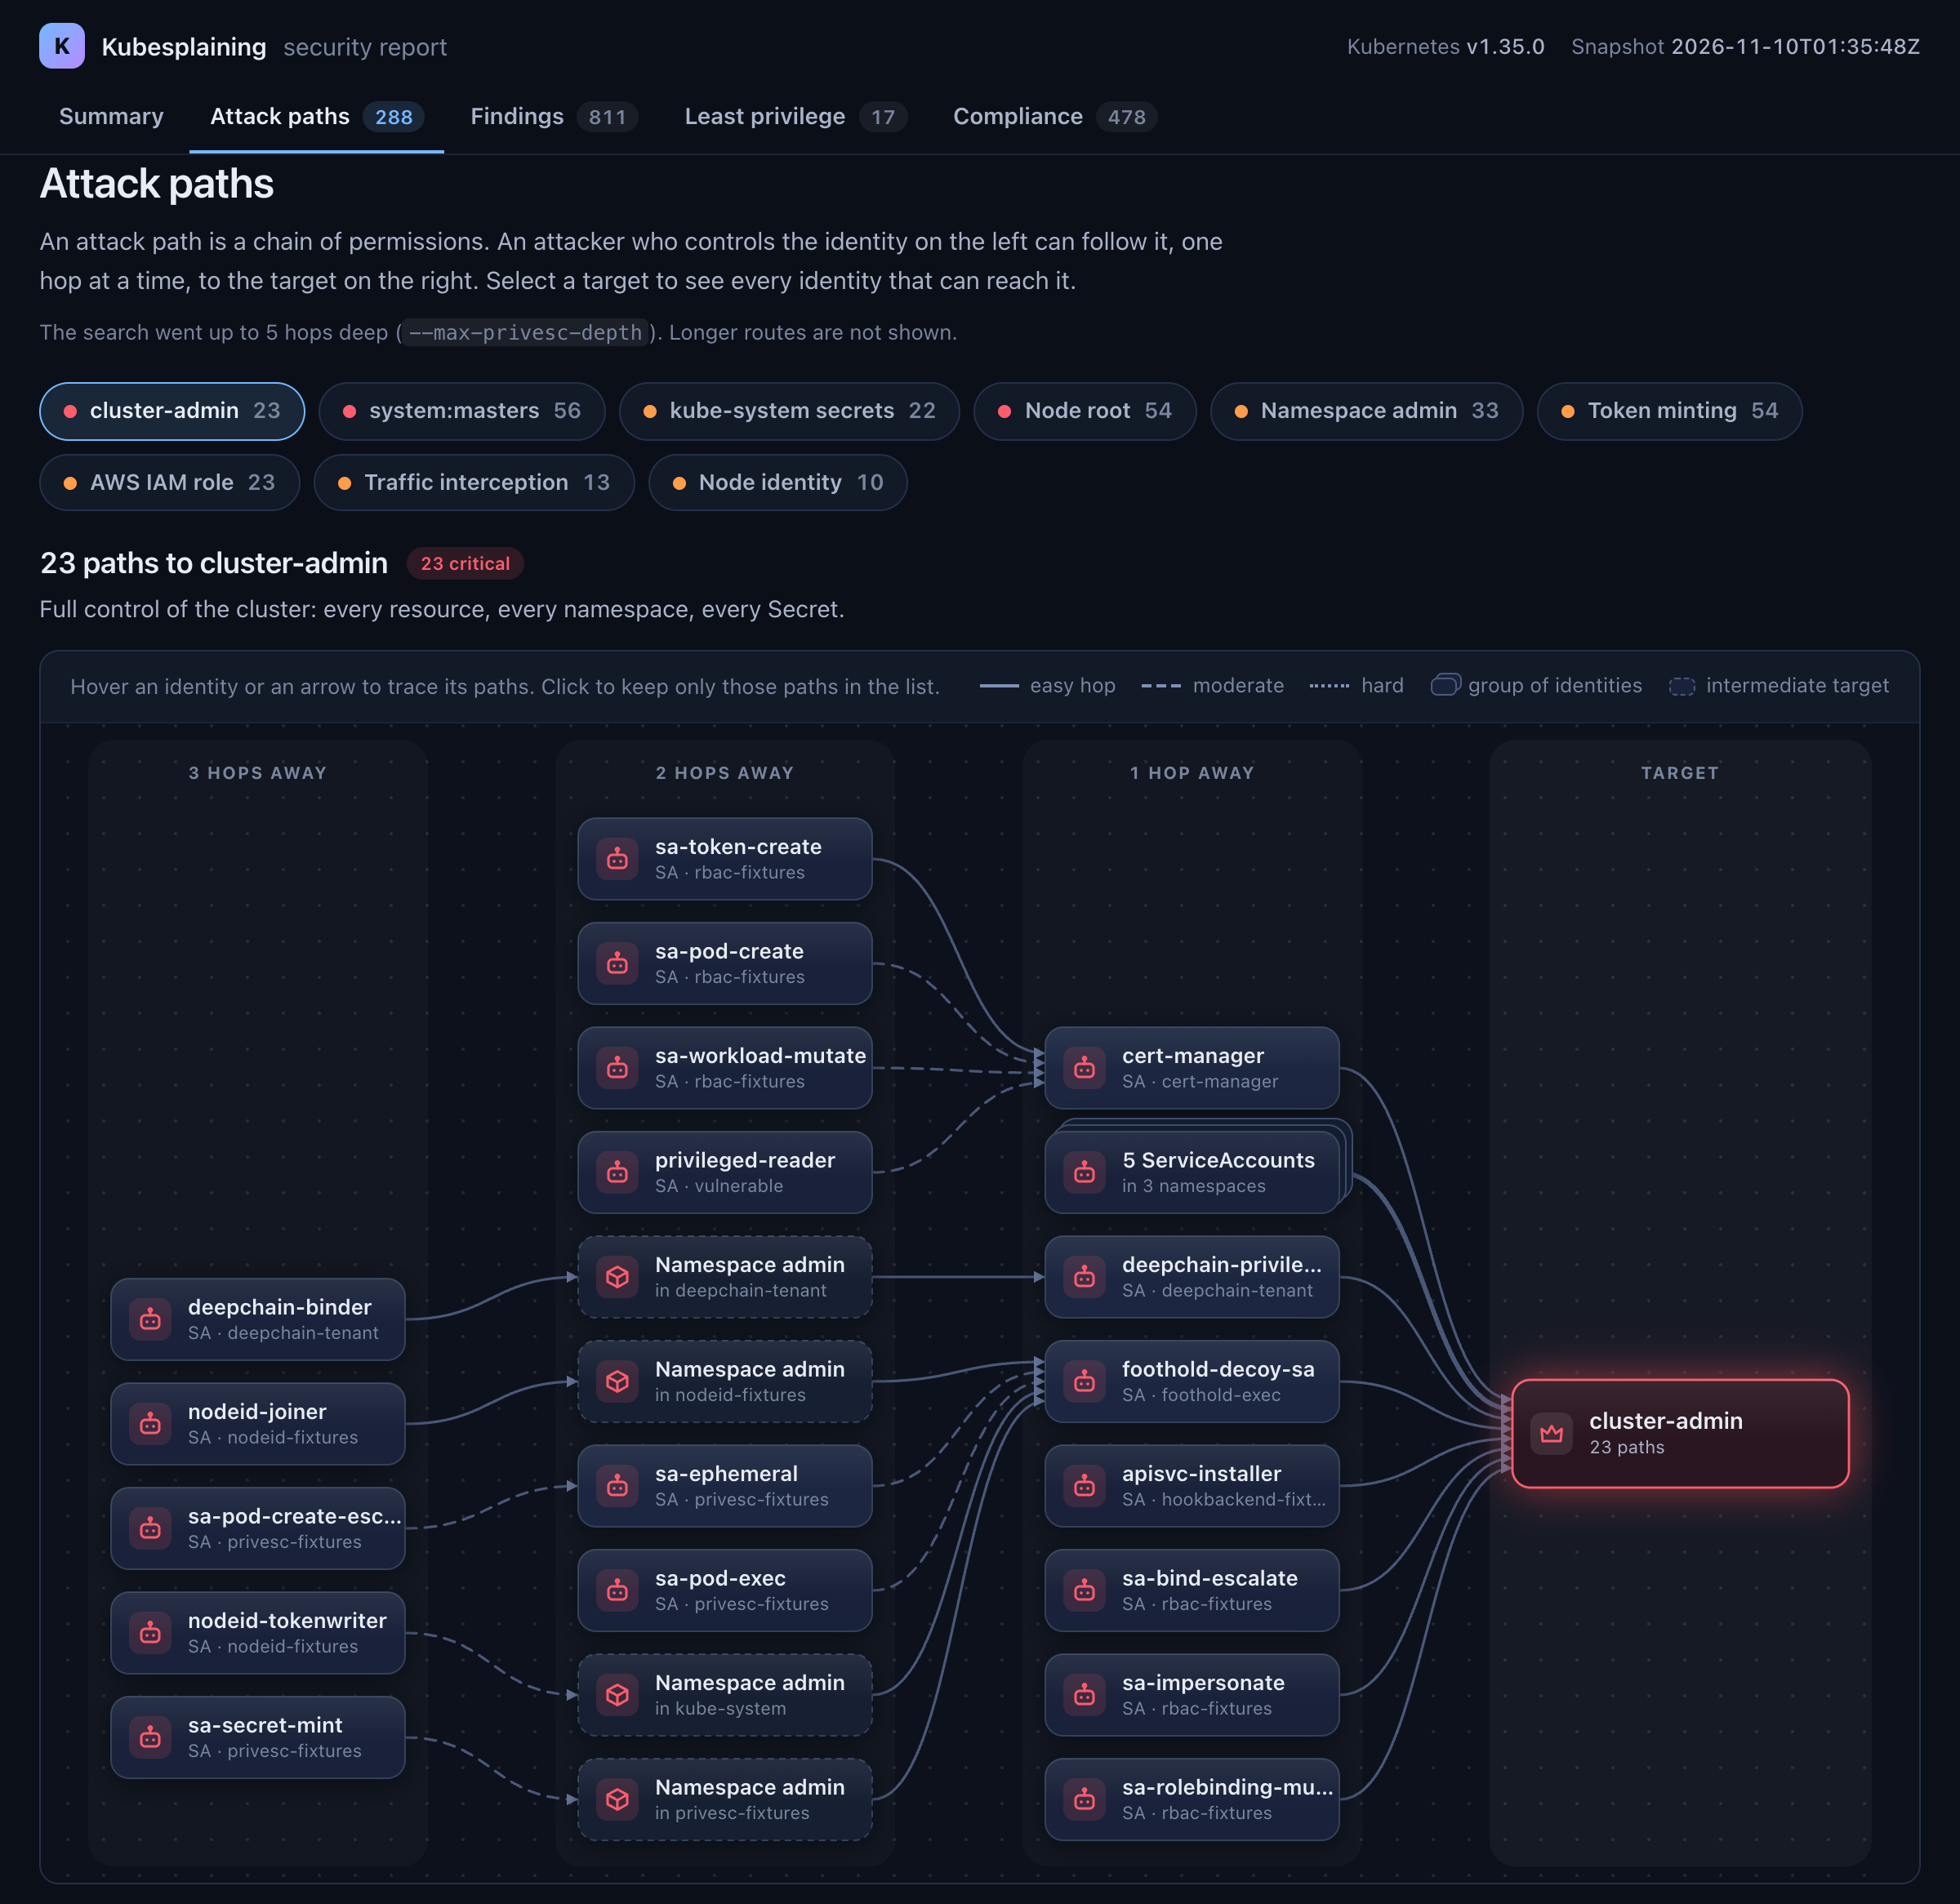
The Attack paths tab of the HTML report. Each box is an identity and each arrow is one hop. The columns show how many hops an identity is from the target. Here, 23 paths end at cluster-admin, and the longest has three hops.
Install
Pick whichever fits your workflow.
From a fresh clone (easiest, no install needed):
git clone https://github.com/0hardik1/kubesplaining
cd kubesplaining
make scan
make scan builds the binary (Hermit auto-downloads the pinned Go toolchain) and runs it against your current kubectl context in one step.
See Installation below for krew, go install, pre-built binaries, and checksums.
vs the alternatives
Most scanners overlap on "is this pod privileged?" The differentiator is whether they show you the chain from a non-admin subject to cluster takeover, and whether they ship an actionable fix.
| Capability | kubesplaining | kubescape | trivy | polaris |
|---|---|---|---|---|
| Multi-hop RBAC privesc graph | Yes (BFS over RBAC + pod state to 9 sinks, full hop chain) | No (per-binding flags only) | No | No |
| Per-finding remediation (patch / Kyverno / Gatekeeper) | Yes (prose per rule; kubectl patch + policy YAML with --remediation-patches) |
Partial (control description) | Partial (text only) | Partial (text only) |
| Snapshot diff for CI delta gates | Yes (scan --baseline old.json, fail only on new findings) |
No | No | No |
Inspired by Kinnaird McQuade at BeyondTrust Phantom Labs and his Cloudsplaining, which does the same job for AWS IAM. Kubesplaining reads a live cluster or a previously captured snapshot, analyzes it against a library of techniques, and produces a prioritized list of findings: explanation, not just detection.
Why kubesplaining
Most Kubernetes scanners stop at "this resource is misconfigured." Kubesplaining answers a different question: how would an attacker actually move through your cluster? Given the RBAC bindings and pods you already have, it walks the escalation graph from every non-system subject and tells you which can reach cluster-admin, host root, or kube-system secrets, with the full hop chain attached.
It focuses on the ground attackers actually exploit:
- Privilege escalation paths: graph-based chains of "subject A can become subject B can reach sink X" via BFS to nine sinks (
cluster-admin,system:masters,node-escape,kube-system-secrets,namespace-admin,token-mint,aws-iam-role,traffic-intercept,node-identity). - Overly permissive RBAC: wildcards, impersonation, bind/escalate, secret reads, pod creation, token mint.
- Pod-escape surface area: privileged containers, host namespaces, sensitive hostPath mounts, container socket mounts.
- Network isolation gaps: namespaces with no NetworkPolicy, policies that allow broad internet egress.
- Admission-control bypass: webhooks that fail open, objectSelector bypasses, exempt sensitive namespaces.
- Secrets and service-account hygiene: legacy token secrets, credentials in ConfigMaps, default-SA mounting, DaemonSet token blast-radius.
Every finding names the technique, shows the evidence, and includes remediation.
Use cases:
- Pentest / red-team engagements: the escalation paths are the attack plan.
- Security review before a new binding: see if it closes the graph from someone untrusted to a sink.
- Continuous assurance in CI:
--ci-modewith severity budgets fails the pipeline when high-severity findings cross a threshold. - Post-incident replay: capture the snapshot, analyze offline, explain how the actor could have moved.
Quickstart
After installing (see Installation below), point Kubesplaining at your current kubectl context:
kubesplaining scan                          # writes ./kubesplaining-report/
open kubesplaining-report/report.html       # macOS; xdg-open on Linux
To ask one question in the terminal, with no report to open:
kubesplaining paths --to cluster-admin              # who can reach cluster-admin?
kubesplaining paths --from ServiceAccount/dev/ci    # what can this identity reach?
See Ask a question for the output and the other filters.
Already cloned the repo? make scan builds the binary (Hermit auto-downloads the pinned Go toolchain) and runs it against your current kubectl context in one step, no separate install needed. Pass extra flags via ARGS, e.g. make scan ARGS="--severity-threshold high --only-modules privesc".
For air-gapped or audit workflows, capture a snapshot first and analyze it offline:
kubesplaining download --output-file snapshot.json
kubesplaining scan --input-file snapshot.json
For one-off manifest checks without cluster access:
kubesplaining scan-resource --input-file deployment.yaml
Installation
Pick the path that fits. They all produce the same kubesplaining CLI. The top of this README covers the from-clone path; this section adds krew, Go install, pre-built binaries, and Docker.
kubectl krew
Install as a kubectl plugin via Krew:
kubectl krew install kubesplaining
kubectl kubesplaining scan
Every command in this README works the same way behind kubectl, e.g. kubectl kubesplaining scan --input-file snapshot.json.
Go install
go install github.com/0hardik1/kubesplaining/cmd/kubesplaining@latest
Pre-built binary
Grab the archive matching your OS / arch from the Releases page, extract, and put kubesplaining on your PATH. Each release ships:
kubesplaining_<version>_Linux_x86_64.tar.gz/Linux_arm64.tar.gzkubesplaining_<version>_Darwin_x86_64.tar.gz/Darwin_arm64.tar.gzkubesplaining_<version>_Windows_x86_64.zipkubesplaining_<version>_checksums.txt(SHA-256)
Verify the checksum, then move the binary into place:
shasum -a 256 -c kubesplaining_<version>_checksums.txt
sudo install kubesplaining /usr/local/bin/
Docker
docker run --rm \
  --user "$(id -u):$(id -g)" \
  -v "$HOME/.kube/config:/kubeconfig:ro" -e KUBECONFIG=/kubeconfig \
  -v "$PWD:/work" -w /work \
  ghcr.io/0hardik1/kubesplaining:latest scan
The report is written to ./kubesplaining-report/ in the current directory. --user makes the container run as you, so it can read your kubeconfig and write the report with your ownership.
The image holds only the kubesplaining binary. Two kinds of kubeconfig do not work from inside it:
- A kubeconfig that calls a helper program for credentials (EKS with
aws eks get-token, GKE withgke-gcloud-auth-plugin). - A kubeconfig that points at
127.0.0.1(kind, minikube, Docker Desktop).
For those clusters, use the binary. You can also capture a snapshot with the binary and analyze it in the container, which needs no kubeconfig:
docker run --rm --user "$(id -u):$(id -g)" -v "$PWD:/work" -w /work \
  ghcr.io/0hardik1/kubesplaining:latest scan --input-file snapshot.json
What it checks
104 stable rule IDs across 11 modules today, plus the privilege-escalation graph that chains them. Full per-rule severity, detection logic, and remediation: docs/findings.md.
| Module | Rules | Focus |
|---|---|---|
| rbac | 33 | wildcard / impersonate / bind-escalate / secret-read / pod-create / nodes-proxy / token-create, the two-verb pairs the API server actually enforces (CSR create + approve, signer control, mutating-policy write + bind), and a version-gated CVE rule: write on both statefulsets and controllerrevisions steers kube-controller-manager into cross-namespace pod creation (CVE-2026-2270), reported only when the server version is unpatched |
| podsec | 19 | privileged, host namespaces, hostPath, container sockets, runAsRoot, dangerous capabilities, seccomp / procMount, PSA namespace labels, mutable tags |
| containersec | 4 | missing limits, missing probes, lifecycle exec hooks, images not digest-pinned |
| network | 7 | namespaces missing NetworkPolicy, broad-internet and IMDS egress, cross-namespace bridges, unselected workloads |
| admission | 4 | failurePolicy: Ignore, objectSelector bypass, sensitive-namespace exemptions, no policy engine at all |
| secrets | 8 | legacy SA token secrets, credential-like ConfigMap keys, CoreDNS tampering, cross-namespace Secret reach, TLS expiry, stale Secrets |
| serviceaccount | 4 | privileged SAs, default-SA RBAC, DaemonSet token blast-radius |
| certificates | 2 | CertificateSigningRequest objects: a workload ServiceAccount asking for a client cert, or a request against the legacy-unknown signer |
| privesc | 10 (9 sinks) | graph chains to cluster-admin / system:masters / node-escape / kube-system-secrets / namespace-admin / token-mint / aws-iam-role / traffic-intercept / node-identity. Hops are not only direct grants: workload controllers, catalogued operators steered as confused deputies (Flux, Argo CD, cert-manager, ...), and the CVE-2026-2270 StatefulSet-controller edge all appear as controller-mediated hops, and every path says whether its own recommended cut actually closes the route |
| cloud (EKS) | 9 | aws-auth and EKS Access Entry mappings to system:masters or admin-equivalent roles, IRSA admin roles, IMDS node-role pivot |
| leastprivilege | 4 | granted-but-unused RBAC verbs from audit-log diff; opt-in via --audit-log. See docs/audit-logs.md for setup and the Least-Privilege analyzer section for the behavior matrix |
Every finding is tagged with a RiskCategory (privilege_escalation, data_exfiltration, lateral_movement, infrastructure_modification, defense_evasion) so the HTML report can group by impact lane.
Rule IDs are a public surface: they are stable across releases and referenced from findings.json, the SARIF output, and the e2e assertions in scripts/kind-e2e.sh.
How it works
Four-stage pipeline:
┌───────────────┐    ┌───────────────┐    ┌───────────────┐    ┌───────────────┐
│  Connection   │ →  │  Collection   │ →  │   Analysis    │ →  │    Report     │
│  kubeconfig   │    │ snapshot.json │    │ 11 modules ∥  │    │  html/json/   │
│ / in-cluster  │    │ RBAC+workload │    │  findings[]   │    │   csv/sarif   │
└───────────────┘    └───────────────┘    └───────────────┘    └───────────────┘
The boundary that matters most: the collector is the only thing that talks to the Kubernetes API; analyzers consume a Snapshot and never make network calls. That's what makes download → scan --input-file work for offline analysis. Read-only access is sufficient: no admission webhooks, no agents, no CRDs installed.
For the per-stage walkthrough, the privesc graph mechanics, the data model, and the scoring formula: docs/architecture.md.
Sample finding
What the output looks like. Each rule produces a finding with a stable rule_id, a severity, evidence, and a remediation. A privesc path finding also has an escalation_path array.
The three samples below come from the findings.json of the live example report. Each sample is abridged: the long text fields (description, impact, attack_scenario, remediation_steps, references, learn_more) and the namespace, scope, tags, mitre_techniques, and frameworks fields are left out.
KUBE-PRIVESC-PATH-CLUSTER-ADMIN: service account reaches cluster-admin in 2 hops
{
  "id": "KUBE-PRIVESC-PATH-CLUSTER-ADMIN:ServiceAccount/rbac-fixtures/sa-pod-create:cluster_admin_equivalent",
  "rule_id": "KUBE-PRIVESC-PATH-CLUSTER-ADMIN",
  "severity": "CRITICAL",
  "score": 9.25,
  "category": "privilege_escalation",
  "title": "`ServiceAccount/rbac-fixtures/sa-pod-create` can reach **cluster-admin equivalent** in 2 hop(s)",
  "subject": { "kind": "ServiceAccount", "name": "sa-pod-create", "namespace": "rbac-fixtures" },
  "evidence": {
    "chain_summary": [
      "1. pod_create_token_theft [create pods]",
      "2. wildcard_permission [*:*:*]"
    ],
    "first_action": "pod_create_token_theft",
    "hop_count": 2,
    "target": "cluster_admin_equivalent",
    "target_namespace": "",
    "techniques": [
      "pod_create_token_theft",
      "wildcard_permission"
    ]
  },
  "escalation_path": [
    {
      "step": 1,
      "action": "pod_create_token_theft",
      "technique": "KUBE-PRIVESC-001",
      "difficulty": "moderate",
      "from_subject": { "kind": "ServiceAccount", "name": "sa-pod-create", "namespace": "rbac-fixtures" },
      "to_subject": { "kind": "ServiceAccount", "name": "cert-manager", "namespace": "cert-manager" },
      "permission": "create pods",
      "gains": "can create pods that mount ServiceAccount cert-manager/cert-manager",
      "source_binding": "crb-pod-create",
      "source_role": "cr-pod-create"
    },
    {
      "step": 2,
      "action": "wildcard_permission",
      "technique": "KUBE-PRIVESC-017",
      "difficulty": "easy",
      "from_subject": { "kind": "ServiceAccount", "name": "cert-manager", "namespace": "cert-manager" },
      "to_subject": { "kind": "", "name": "" },
      "permission": "*:*:*",
      "gains": "wildcard verbs on wildcard resources in wildcard API groups",
      "source_binding": "cutres-deputy-cm-admin",
      "source_role": "cluster-admin"
    }
  ],
  "remediation": "Break the chain at the weakest hop: remove the `create pods` capability that enables hop 1 (`ServiceAccount/rbac-fixtures/sa-pod-create` → `ServiceAccount/cert-manager/cert-manager`)."
}
The last hop ends at the target, not at an identity, so its to_subject is empty. evidence.target names the target.
The HTML report draws this path in the graph of its target on the Attack paths tab, and lists it as a row that opens to show each hop. The SARIF output keeps the chain in the properties.escalation_path field of each result for IDE integration.
KUBE-ESCAPE-001: privileged container
{
  "id": "KUBE-ESCAPE-001:Deployment:vulnerable:risky-app:app",
  "rule_id": "KUBE-ESCAPE-001",
  "severity": "CRITICAL",
  "score": 9.9,
  "category": "privilege_escalation",
  "title": "Privileged container `app` in `Deployment/vulnerable/risky-app`",
  "resource": { "kind": "Deployment", "name": "risky-app", "namespace": "vulnerable", "api_group": "apps" },
  "evidence": { "container": "app" },
  "remediation": "Remove `privileged: true` and explicitly grant only the Linux capabilities the workload actually needs."
}
KUBE-RBAC-OVERBROAD-001: ServiceAccount bound directly to cluster-admin
{
  "id": "KUBE-RBAC-OVERBROAD-001:ServiceAccount/rbac-fixtures/sa-cluster-admin::",
  "rule_id": "KUBE-RBAC-OVERBROAD-001",
  "severity": "CRITICAL",
  "score": 10,
  "category": "privilege_escalation",
  "title": "Non-system subject `ServiceAccount/rbac-fixtures/sa-cluster-admin` directly bound to `cluster-admin`",
  "subject": { "kind": "ServiceAccount", "name": "sa-cluster-admin", "namespace": "rbac-fixtures" },
  "resource": { "kind": "RBACRule", "name": "cluster-admin", "api_group": "rbac.authorization.k8s.io" },
  "evidence": {
    "api_groups": null,
    "namespace": "",
    "resource_names": null,
    "resources": null,
    "scope": "cluster",
    "source_binding": "crb-cluster-admin",
    "source_binding_kind": "ClusterRoleBinding",
    "source_role": "cluster-admin",
    "source_role_kind": "ClusterRole",
    "verbs": null
  },
  "remediation": "Replace `cluster-admin` with a custom least-privilege ClusterRole, or scope the binding to a dedicated short-lived admin group reachable only via JIT/break-glass procedures."
}
For the full rule catalog (severity, detection, remediation per rule): docs/findings.md.
Ask a question
scan writes a full report. paths answers one question in the terminal. It searches the same graph, so each path has the same ID, score, and hops as the finding in the report.
Who can reach a target? --to keeps the paths that end at one target:
$ kubesplaining paths --to cluster-admin
SEVERITY  SCORE  SOURCE                                TARGET         HOPS  CHAIN
CRITICAL  9.65   ServiceAccount/dashboard/admin-sa     cluster-admin  1     bound_to_cluster_admin
CRITICAL  9.25   ServiceAccount/monitoring/prometheus  cluster-admin  2     pod_create_token_theft > bound_to_cluster_admin

2 attack paths.
What can one identity reach? --from starts the search at that identity. Add --verbose to see each hop, the binding that grants it, and the fix:
$ kubesplaining paths --from ServiceAccount/monitoring/prometheus --to cluster-admin --verbose
ServiceAccount/monitoring/prometheus -> cluster-admin
  severity: CRITICAL (score 9.25)   hops: 2
  id: KUBE-PRIVESC-PATH-CLUSTER-ADMIN:ServiceAccount/monitoring/prometheus:cluster_admin_equivalent

  1. pod_create_token_theft (moderate)
     from:       ServiceAccount/monitoring/prometheus
     to:         ServiceAccount/dashboard/admin-sa
     permission: create pods
     granted by: ClusterRoleBinding prometheus-reader (role prometheus-reader)
     result:     can create pods that mount ServiceAccount dashboard/admin-sa
  2. bound_to_cluster_admin (easy)
     from:       ServiceAccount/dashboard/admin-sa
     to:         cluster-admin
     permission: cluster-admin
     granted by: ClusterRoleBinding dashboard-admin (role cluster-admin)
     result:     bound to cluster-admin via dashboard-admin

  fix: Break the chain at the weakest hop: remove the create pods capability that enables hop 1 (ServiceAccount/monitoring/prometheus → ServiceAccount/dashboard/admin-sa).
    # Edit the binding and remove the offending subject from subjects:.
    kubectl edit clusterrolebinding prometheus-reader
The real output ends with a diff of that binding, left out here.
paths reads the live cluster by default. Each run collects the cluster again, so for more than one question capture the cluster one time and ask offline. An answer from a snapshot takes less than a second and needs no cluster access:
kubesplaining download --output-file snapshot.json
kubesplaining paths --input-file snapshot.json --to node-escape
kubesplaining paths --input-file snapshot.json --from ServiceAccount/dev/ci --output-format json
| Flag | Purpose |
|---|---|
--to <target> |
Keep the paths that end at one target: cluster-admin, system-masters, kube-system-secrets, node-escape, namespace-admin[:<namespace>], token-mint, aws-iam-role[:<arn>], traffic-intercept, node-identity. The names in findings.json (kube_system_secrets) also work. |
--from <identity> |
Start at one identity: ServiceAccount/<namespace>/<name> (or sa/<namespace>/<name>), User/<name>, Group/<name>. This is the form that the reports print, so you can paste it. system:serviceaccount:<namespace>:<name> also works. |
--id <finding-id> |
Keep the one path that has this finding ID. |
--verbose |
Show each hop with its binding and role, then the fix. |
--output-format json |
Print {"total", "returned", "paths": [...]}. Each path is a short record (source, target, severity, score, hops) without the explanatory prose of a full finding, so the output stays small for a script or an AI agent. |
--limit <n> |
List only the first N paths, highest severity and score first. total still counts all matches. |
Three behaviors to know:
- With no
--from,pathslists the attack paths thatscanreports, and the same exclusions apply. The output says how many paths the exclusions hide. --fromignores the exclusions, and it accepts an identity thatscandoes not use as a starting point: a built-insystem:identity, a control-plane ServiceAccount, or a group such asGroup/system:authenticated("what can every authenticated user reach?").- An identity that is not in the cluster is an error, not an empty answer. An empty answer for a mistyped name would look like "this identity is safe".
Check a change before you apply it
--overlay applies manifests on top of a snapshot in memory. --overlay-delete removes one object. --diff then lists the attack paths that the change adds, removes, and changes. Nothing touches the cluster, so you can ask "does this RoleBinding open a path?" in a pull request, or "does this fix close the path?" before you run kubectl.
A new binding that looks harmless in review:
$ kubesplaining paths --input-file snapshot.json --overlay ci-deployer-admin.yaml --diff
ADDED (2)
SEVERITY  SCORE  SOURCE                         TARGET         HOPS  CHAIN
CRITICAL  9.65   ServiceAccount/ci/deployer     cluster-admin  1     bound_to_cluster_admin
CRITICAL  9.25   ServiceAccount/default/reader  cluster-admin  2     pod_create_token_theft > bound_to_cluster_admin

The change adds 2 attack paths, removes 0, and changes 0. 2 stay the same.
$ echo $?
2
The first path is in the manifest. The second is not: default/reader can create pods, so it can now start a pod that runs as the new admin ServiceAccount.
A fix, checked before it is applied:
$ kubesplaining paths --input-file snapshot.json --overlay-delete ClusterRoleBinding/reader-role --diff
REMOVED (2)
SEVERITY  SCORE  SOURCE                         TARGET               HOPS  CHAIN
CRITICAL  9.0    ServiceAccount/default/reader  node-escape          1     pod_create_privileged_escape
HIGH      8.45   ServiceAccount/default/reader  kube-system-secrets  1     read_secrets

The change adds 0 attack paths, removes 2, and changes 0. 0 stay the same.
A path that stays open by a second route is not listed as removed. It is listed under CHANGED, with the binding behind each route, so a fix that is not sufficient does not look like a fix:
$ kubesplaining paths --input-file snapshot.json --to cluster-admin --overlay-delete ClusterRoleBinding/reader-admin-a --diff
CHANGED (1): still open, by a different route
ServiceAccount/default/reader -> cluster-admin
  before: bound_to_cluster_admin [ClusterRoleBinding reader-admin-a (role cluster-admin)]
          also: bound_to_cluster_admin [ClusterRoleBinding reader-admin-b (role cluster-admin)]
  after:  bound_to_cluster_admin [ClusterRoleBinding reader-admin-b (role cluster-admin)]

The change adds 0 attack paths, removes 0, and changes 1. 0 stay the same.
| Flag | Purpose |
|---|---|
--overlay <file|dir|-> |
Apply the manifests in a file, in a directory (read recursively), or from standard input. An object replaces the one with the same kind, namespace, and name, or is added. Repeatable. |
--overlay-delete <object> |
Remove one object: ClusterRoleBinding/<name>, ClusterRole/<name>, RoleBinding/<namespace>/<name>, Role/<namespace>/<name>, ServiceAccount/<namespace>/<name>, Pod/<namespace>/<name>. An object that is not in the snapshot is an error. Repeatable. |
--overlay-namespace <ns> |
The namespace for a manifest that has no metadata.namespace, as with kubectl apply -n. Without it, such a manifest is an error. |
--diff |
Compare before and after. Exit code 2 when the change adds a path, 0 when it does not, 1 when the command fails. |
For a Helm chart or a Kustomize directory, render first and pipe the result in:
helm template my-release ./chart | kubesplaining paths --input-file snapshot.json --overlay - --diff
What the overlay does and does not model:
- It applies
Role,ClusterRole,RoleBinding,ClusterRoleBinding,ServiceAccount,Namespace, andPod. It skips other kinds and says so. ADeploymentin the overlay adds no pod, because no controller runs. To model a new workload, overlay aPodwith the same pod spec. - After a change to a ClusterRole, it derives the rules of the aggregated ClusterRoles (
admin,edit,view, and your own) again, so a new role with anaggregate-to-*label has its effect. --diffdoes not apply the default exclusions, so a path that the change adds is never hidden. Pass an exclusions flag to apply them.scantakes the same three--overlayflags and writes a full report of the state after the change. The report says that it includes an overlay.
Use with an AI agent
The repository ships an Agent Skill named attack-paths. A skill is a Markdown file that tells a coding agent when and how to use a tool. With the skill installed, you can ask in plain words:
- "Who can reach cluster-admin in this cluster?"
- "What can the
ciServiceAccount indevescalate to? Give me the smallest fix." - "Review the RBAC in this cluster and show me the three worst paths."
The agent captures a snapshot with kubesplaining download, gets the answer from kubesplaining paths as JSON, explains each hop, proposes the change to the binding, and checks that change offline with --overlay and --diff before it shows it to you. The skill tells the agent not to change the cluster: you get a command or a patch, and you apply it.
In Claude Code:
/plugin install kubesplaining --marketplace 0hardik1/kubesplaining
Or from a shell:
claude plugin marketplace add 0hardik1/kubesplaining
claude plugin install kubesplaining@kubesplaining
For other agents: the skill uses only the fields of the open Agent Skills format, so an agent that reads SKILL.md files can use it. Copy plugins/kubesplaining/skills/attack-paths/ into the skills directory of your agent.
What to know before you use it:
- The skill needs the
kubesplainingbinary on yourPATH, from v1.4.0 or later, the first release that has thepathscommand. It does not install the binary for you. - The agent runs the binary with your kubeconfig, so it can read what you can read.
kubesplainingonly reads. - The agent sees the output of
paths: the names of identities, bindings, and roles. The skill tells it to keep the snapshot file out of the repository and not to send the file to a different service.
Offline analysis
The collector and the analyzer are decoupled: the snapshot is a plain JSON file. Capture once, analyze repeatedly, in environments where credentials shouldn't sit on the analyst's machine:
# On a jumphost with cluster credentials:
kubesplaining download --output-file snapshot.json

# Move snapshot.json to your laptop / audit machine, then:
kubesplaining scan --input-file snapshot.json
Useful for:
- Audit trails: the snapshot is the evidence; reruns produce identical findings.
- Air-gapped review: analyze a production cluster without bringing kubeconfig off the jumphost.
- Manifest scans:
kubesplaining scan-resource --input-file deployment.yamlruns the same analyzers against a single YAML, no cluster needed.
Privacy posture for snapshots
The collector never reads raw Secret values (only metadata) and blanks every ConfigMap value through redactConfigMapValues so keys survive but payloads do not. Two well-known kube-system ConfigMaps are carve-outs and are stored verbatim because the analyzers that consume them need the values:
kube-system/aws-auth: the EKSmapRoles/mapUserspayload (IAM role and user ARNs, mapped Kubernetes usernames and groups) is read by the cloudaws-authanalyzers to name the IAM principal that has cluster-admin reach. A snapshot from an EKS cluster therefore contains the cluster's IAM-to-RBAC trust map verbatim.kube-system/coredns: the Corefile value is substring-matched byKUBE-CONFIGMAP-002to detect rewrite directives and external DNS forwarders (forward . 8.8.8.8,forward . 1.1.1.1,forward . tls://...).
Treat snapshot files (and any HTML/JSON/CSV/SARIF reports generated from them) as sensitive when sharing across teams or storing in CI artifact buckets, especially on EKS clusters where the aws-auth carve-out exposes account IDs, IAM role inventory, and SSO group naming conventions. Every other ConfigMap value (including ones not on this allow-list) is blanked.
Live EKS demo
Provisions a real EKS cluster in your own AWS account that exhibits a cross-namespace + AWS-pivot privilege escalation chain kubesplaining detects, then walks through actually exploiting it (privileged-pod node escape → harvest a co-resident IRSA token → assume the AWS role via STS → loop back as system:masters via aws-auth). Useful as a self-service teaching environment.
make eks-demo-up      # ~12 min: cluster + IAM + S3 + K8s manifests + aws-auth mapping
make eks-demo-scan    # ~30 sec: produces .tmp/eks-demo-report/report.html
make eks-demo-poc     # default dry-run; --execute to step through the attack interactively
make eks-demo-down    # ~10 min: tears down everything (cluster, IAM role, S3 bucket)
The cluster is named holy-splain. All AWS resources carry generic, account-agnostic names so the same scripts reproduce identically across operators. Cost: approximately $5/day while running.
Three docs go with the demo:
docs/eks-demo.md: operator reference (prereqs, commands, troubleshooting).docs/eks-demo-walkthrough.md: chapter-style learning narrative. Walks through the attack chain step by step, explains every K8s and AWS internal involved (IRSA, projected SA tokens, Pod Security Admission, aws-auth, STS assume-role-with-web-identity), and ends with a defense recap of where each link in the chain could be broken.docs/eks-demo-iam.md: operator IAM permissions required to run the setup.
Least-Privilege analyzer (audit-log driven)
The leastprivilege module compares the RBAC permissions a ServiceAccount has (from the snapshot) against the ones it has actually exercised (from a kube-apiserver audit log) and flags the delta. It's the analog of AWS IAM Access Advisor for Kubernetes RBAC.
It emits four rule IDs:
KUBE-RBAC-UNUSED-ROLE-001: Role bound to a mounted SA with zero observed events in the audit window.KUBE-RBAC-UNUSED-RULE-001: Every (verb, resource) triple in a Role rule is unused.KUBE-RBAC-UNUSED-VERB-001: Some verbs in a Role rule are unused; suggests a narrower verb list.KUBE-RBAC-WILDCARD-USED-PARTIAL-001:verbs: ["*"]is granted but the SA only used a subset.
The pre-existing KUBE-RBAC-STALE-* rules surface alongside in the Least privilege HTML tab so dangling-binding cleanup and verb-level narrowing live in one view. Cluster-admin grants live in their own "Subjects bound to cluster-admin" inventory table on the same tab: directly bound subjects are listed for review rather than each one being flagged CRITICAL, because cluster-admin has legitimate uses (system:masters, break-glass groups) that vary by cluster. The standalone KUBE-RBAC-OVERBROAD-001 finding still fires from the rbac module and shows up in the main Findings tab (and in JSON/CSV/SARIF output) for operators who want the per-binding alert.
When does it fire?
The module is opt-in via --audit-log. A plain kubesplaining scan (no audit log) silently skips it, so no LP findings ship and existing CI baselines stay unchanged.
| Command | Audit log required? | What you get |
|---|---|---|
kubesplaining scan / make scan |
No | Same behavior as before; module silently no-ops. |
scan --audit-log <path> |
Used if supplied | LP findings appear alongside the regular findings. |
scan --least-privilege-only --audit-log <path> |
Yes (CLI pre-flight errors if missing) | Only LP findings; HTML report opens on the Least privilege tab; Summary / Attack paths / Findings / Compliance tabs are hidden. |
make scan-lp AUDIT_LOG=<path> |
Yes (Makefile errors if missing) | Same as the focused mode above; convenience target. |
Quick start
# 1. Capture audit logs from your cluster - see docs/audit-logs.md for
#    kubeadm / kind / EKS setup. Audit policy level "Metadata" is enough.

# 2. Run the focused mode against a snapshot (or live cluster) + your audit log:
make scan-lp AUDIT_LOG=./audit.log ARGS="--input-file snapshot.json"

# or directly:
kubesplaining scan \
  --input-file snapshot.json \
  --audit-log ./audit.log \
  --audit-source native \
  --audit-window-days 30 \
  --least-privilege-only
What's in the report
The Least privilege tab carries two summary tables on top, each row spelling out the exact action:
- Unused RBAC objects: Roles/ClusterRoles/Bindings that look like delete candidates. Each row names the object to remove (e.g.
Delete RoleBinding/billing/cleanup-cron (target Role missing)). - Verbs to remove: Verb-level narrowing opportunities with side-by-side Used vs Unused verb lists grouped by verb (
get: deployments|pods), plus a "What to do" action and the suggested narrower-Role YAML on the per-finding card below.
When the audit log contains non-ServiceAccount callers (humans, groups, kubelets), the tab shows a one-line note explaining they're out of scope: kubesplaining only correlates ServiceAccount-bound RBAC, and human users belong in IdP / SSO group review.
Audit log details
docs/audit-logs.md walks through enabling audit logging on self-managed / kubeadm, kind, and EKS clusters, what audit-policy level is needed, and how to export from CloudWatch. The privacy posture is preserved: audit Metadata level does not include request bodies, so secrets and ConfigMap values are still never read.
CI integration
The SARIF output integrates with GitHub code scanning so findings appear as PR annotations. On GitHub Actions, the GitHub Action runs the scan and uploads findings.sarif in one step.
On any other CI system, call the CLI and fail the build on findings over budget with --ci-mode:
kubesplaining scan --ci-mode --ci-max-critical 0 --ci-max-high 0
--ci-mode exits with code 2 when the count of critical / high findings crosses the configured thresholds; combine with --severity-threshold to scope what counts. Any other failure (bad flags, unreachable cluster) exits with code 1, so a pipeline can tell "over budget" from "the scan did not run". The gate counts every finding: --max-findings shortens the HTML report only.
Exclusions
scan, scan-resource, and report auto-apply the standard exclusions preset by default, so findings about built-in Kubernetes plumbing are suppressed up front. That covers kube-system / kube-public / kube-node-lease / gatekeeper-system namespaces, kube-controller-manager service accounts (clusterrole-aggregation-controller, generic-garbage-collector, …), system:* users / groups / roles, and kubeadm:* groups and bootstrap roles. None of it is something an operator can change without breaking their cluster, so showing it as risk just buries the things that are actionable.
Pick a different baseline with --exclusions-preset:
| Preset | Behavior |
|---|---|
standard (default) |
Auto-applied. Filters kube-system / system:* / kubeadm:* noise. |
minimal |
Filters only kube-public, kube-node-lease, and system:*. |
none (alias strict) |
No built-in filtering: every finding surfaces, including control-plane noise. |
Layer custom rules on top with --exclusions-file path.yml. The user file is merged with the preset, so you keep the defaults and add your own suppressions (specific service accounts, expected workloads, custom rule-ID patterns). Generate a starter file:
kubesplaining create-exclusions-file --preset standard --output-file exclusions.yml
See docs/exclusions.md for the full YAML schema (Global / RBAC / PodSecurity / NetworkPolicy sections, all matchers support shell-style globs).
To audit what the defaults are hiding, re-run with --exclusions-preset=none and diff.
Cheatsheet
Commands
| Command | Purpose |
|---|---|
kubesplaining scan |
Analyze (live or --input-file) and write reports. |
kubesplaining paths |
Answer one question in the terminal: who can reach a target (--to), what an identity can reach (--from). |
kubesplaining download |
Capture a snapshot.json from a live cluster. Read-only. |
kubesplaining scan-resource |
Scan a single resource manifest for quick checks. |
kubesplaining report |
Re-render reports from an existing findings JSON. |
kubesplaining diff |
Compare two findings JSON files and list the findings that were added, resolved, or unchanged. |
kubesplaining create-exclusions-file |
Emit a starter exclusions YAML. |
kubesplaining version |
Print build info. |
Frequently used flags
| Flag | Default | Purpose |
|---|---|---|
--severity-threshold |
low |
Hide findings below this severity (critical / high / medium / low / info). |
--output-format |
html,json |
Comma-separated list: html, json, csv, sarif. |
--output-dir |
./kubesplaining-report |
Where reports are written. |
--only-modules / --skip-modules |
(none) | Scope analyzers (rbac, podsec, containersec, network, admission, secrets, serviceaccount, certificates, privesc, cloud, leastprivilege). |
--least-privilege-only |
false |
Focus mode: hide everything except RBAC tightening opportunities and land on the Least privilege tab. Requires --audit-log. |
--audit-log |
(none) | Path to a kube-apiserver audit log (file or directory; repeatable). Opt-in: without it the leastprivilege module is a no-op. See docs/audit-logs.md for setup on self-managed, kind, and EKS. |
--audit-source |
native |
Audit-log format: native (kube-apiserver JSON-lines) or eks (CloudWatch filter-log-events export). |
--audit-window-days |
30 |
How many days of audit history to consider. Widen for monthly cron jobs. |
--max-privesc-depth |
5 |
BFS depth cap for the escalation graph. |
--eks-access-entries |
(none) | Path to an EKS access-entries export from scripts/eks-access-entries.sh <cluster>. Access entries live in the EKS API, not the cluster, so without it an EKS scan reports KUBE-CLOUD-ACCESSENTRY-NOT-EVALUATED-001 rather than silently skipping the IAM-to-RBAC class. See docs/findings.md. |
--ci-mode |
off | Exit with code 2 when over thresholds. Counts every finding. |
--ci-max-critical / --ci-max-high |
0 / 0 |
Max findings allowed at each severity in CI mode. |
--max-findings / --all-findings |
0 / off |
--max-findings N shortens report.html to every attack path plus the top N of the other findings. The default, 0, lists every finding. --all-findings overrides the cap and stays for scripts that pass it. JSON, CSV, and SARIF always hold every finding. |
--exclusions-preset |
standard |
standard / minimal / none. |
--exclusions-file |
(none) | User-supplied YAML, merged on top of the preset. |
--input-file |
(none) | Use a snapshot JSON instead of live collection. |
--namespaces / --exclude-namespaces |
(none) | Filter live collection by namespace. |
--parallelism |
10 |
Max parallel API requests during live collection. |
Output formats
| Format | Use case |
|---|---|
| HTML | Human review; self-contained, works offline, includes per-finding educational copy |
| JSON | Programmatic consumption, snapshot diffing |
| CSV | Triage spreadsheets |
| SARIF | GitHub code scanning, IDE integration |
FAQ
Why is system:masters flagged in some clusters but not others?
The privesc analyzer skips system:* subjects as traversable intermediates (so paths don't launder through the control plane) but it does report system:* as a sink-reach target if you can impersonate or otherwise escalate into it. If the analyzer doesn't see anyone with that capability, the rule stays silent. Three built-in groups are traversed rather than skipped: system:authenticated, system:serviceaccounts, and system:serviceaccounts:<ns>. Every identity of the matching type belongs to them, so a grant to one of them is reported as a path from each member.
How accurate are the privesc paths?
Each hop is validated against the snapshot's RBAC and pod state. The analyzer doesn't speculate. False positives come from chains that are structurally possible but operationally suppressed (e.g. an SA bound to a role that's never actually used). The score goes down with the difficulty of the hops, not with the length of the chain: each hop is rated easy, moderate, or hard, and a chain that has a hard hop drops one severity level. --max-privesc-depth sets the maximum number of hops in a path (default 5).
Can I run this against my prod cluster? Yes. Read-only access is sufficient. No webhooks, CRDs, agents, or pods are installed. Forbidden listings are downgraded to warnings, not fatal, so locked-down clusters still produce useful output.
Why no admission webhook?
Out of scope. The intent is assessment, not enforcement. If you want enforcement, generate Kyverno / Gatekeeper policies from the findings (--remediation-patches) and hand them off to your policy engine.
Why are findings excluded by default?
The standard preset suppresses control-plane noise (kube-system, system:, kubeadm:) that an operator can't change without breaking their cluster. Re-run with --exclusions-preset=none to see everything.
Where to go next
- Full rule catalog (implemented + planned): docs/findings.md
- Architecture deep-dive (per-stage walkthrough, scoring, data model): docs/architecture.md
- Exclusions YAML schema (presets, sections, glob semantics): docs/exclusions.md
- Roadmap & status: PLAN.md
- Releases & changelog: CHANGELOG.md / GitHub Releases
- Contributing: CONTRIBUTING.md
- Security disclosure: SECURITY.md (GitHub Private Vulnerability Reporting only)
- License: Apache-2.0
- End-to-end verification:
make e2eprovisions a local kind cluster with intentionally risky manifests intestdata/and asserts expected findings
Use the GitHub Action
The repository ships a composite Action at action.yml, so you can wire kubesplaining into a workflow without authoring the docker run invocation yourself. The action pulls the GHCR image (the latest tag unless you set version), executes a scan against either a live cluster (via a base64-encoded kubeconfig) or a pre-collected snapshot JSON, and optionally uploads the SARIF result to GitHub code scanning.
# .github/workflows/kubesplaining.yml
name: Kubesplaining
on:
  pull_request:
  push:
    branches: [main]

permissions:
  contents: read
  security-events: write   # required by upload-sarif

jobs:
  scan:
    runs-on: ubuntu-latest
    steps:
      - uses: actions/checkout@v6

      # Option A: scan a pre-collected snapshot checked into the repo.
      - name: Scan offline snapshot
        uses: 0hardik1/kubesplaining@main
        with:
          input-file: testdata/snapshots/minimal-risky.json
          severity-threshold: medium
          fail-on-critical: 'true'
          upload-sarif: 'true'

      # Option B: scan a live cluster. Store the kubeconfig as a base64
      # secret (e.g. `cat ~/.kube/config | base64 | pbcopy`) under the
      # `KUBE_CONFIG_B64` repository secret first.
      # - name: Scan live cluster
      #   uses: 0hardik1/kubesplaining@main
      #   with:
      #     kubeconfig: ${{ secrets.KUBE_CONFIG_B64 }}
      #     severity-threshold: high
      #     compliance: cis
Inputs (all optional unless noted):
| Input | Default | Notes |
|---|---|---|
version |
latest |
GHCR image tag. To pin a release, use the bare version with no v prefix, for example 1.3.0. |
kubeconfig |
(none) | Base64-encoded kubeconfig for live scans. Omit when using input-file. |
input-file |
(none) | Path (relative to the checkout) to a kubesplaining download snapshot JSON. |
severity-threshold |
medium |
critical / high / medium / low / info. |
output-dir |
./kubesplaining-report |
Created if missing. Holds report.html, findings.json, findings.sarif. |
fail-on-critical |
true |
Adds --ci-mode --ci-max-critical 0; flip to false to surface findings without failing the build. |
upload-sarif |
true |
Uploads findings.sarif via github/codeql-action/upload-sarif@v4. Requires security-events: write. |
compliance |
(none) | Optional filter: cis or nsa. |
The ref after @ selects the action definition, and version selects the container image that it runs. The action definitions in releases v1.1.0 to v1.3.0 default version to main, an image tag that was never published. If you pin the action to one of those releases, set version too, for example uses: 0hardik1/[email protected] with version: 1.3.0.
Outputs: report-dir (absolute path to the report directory) and sarif-file (absolute path to findings.sarif, when emitted). The .github/workflows/action-smoke.yml workflow in this repo exercises the action against testdata/snapshots/minimal-risky.json on every PR that touches it.
Credits
- Kinnaird McQuade, for the tool idea. His Cloudsplaining inspired this project.
- Ramesh Ramani (@secmesh): the least-privilege mode was inspired by his idea.
Ähnliche Projekte entdecken
codecrafters-io/build-your-own-x
Meistere das Programmieren, indem du deine Lieblingstechnologien von Grund auf neu erschaffst.
562,354 Sternepublic-apis/public-apis
Eine gemeinschaftliche Liste kostenloser APIs
498,800 Sternemorluto/rea
Mit Agenten alles per Reverse Engineering untersuchen, vom Verhalten der Anwendung bis hin zu nativen Binärdateien.
457,759 Sterneopenclaw/openclaw
Die KI, die wirklich Dinge erledigt. Jedes Betriebssystem, jede Plattform. Auf die Hummer-Art. 🦞
394,399 Sterne